🔣 ML - Classification
 Photo by rawpixel on Unsplash
A Childhood Game
Have you played a Childhood Game called 20 Questions? Someone has a “target” entity in mind ( a person or a thing or a literary character) and the others need to discover that entity by asking 20 questions.
- How does one create questions in the game?
- Categories?
- Numbers? How?
- Comparisons?
- What sort of answers can you expect for each question?
Twenty Questions Game as a Play with Data…
Assuming we think of a 20Q Target as say, celebrity singer like Taylor Swift, or a cartoon character like Thomas the Tank Engine, what would an underlying “data structure” look like? We would ask Questions for instance in the following order to find the target of Taylor Swift:
- Human?(Yes)
- Living?(Yes)
- Male?(No)
- Celebrity?(Yes)
- Music?(Yes)
- USA?(Yes)
Oh…Taylor Swift!!!
Let us try to construct the “datasets” underlying this game!
| name | Occupation | Sex | Living | Nationality | genre | pet |
|---|---|---|---|---|---|---|
| Taylor Swift | Singer | F | TRUE | USA | country/rock | Scottish Fold Cats |
| name | Type | Living | human | Nationality | colour | material |
|---|---|---|---|---|---|---|
| Thomas, the Tank Engine | Cartoon Character | FALSE | FALSE | UK | blue | metal |
It should be fairly clear that the Questions we ask are based on the COLUMNs in the respective 1-row datasets! The TARGET Column in both cases is the name column.
What is a Decision Tree?
Can you imagine how the 20 Questions Game can be shown as a tree?
Each Question we ask, based on one of the Feature columns, begets a Yes/NO answer and we turn the left or right accordingly. When we arrive at the leaf, we should be in a position to guess the answer !
Twenty times 20 Questions !!
What if the dataset we had contained many rows, instead of just one row? How would we play the 20Q Game in this situation? Here is a sample of the famous penguins dataset:
| species | island | bill_length_mm | bill_depth_mm | flipper_length_mm | body_mass_g | sex | year |
|---|---|---|---|---|---|---|---|
| Adelie | Torgersen | 41.8 | 19.4 | 198 | 4450 | male | 2008 |
| Adelie | Dream | 36.9 | 18.6 | 189 | 3500 | female | 2008 |
| Chinstrap | Dream | 52.2 | 18.8 | 197 | 3450 | male | 2009 |
| Gentoo | Biscoe | 46.5 | 13.5 | 210 | 4550 | female | 2007 |
| Adelie | Biscoe | 37.6 | 19.1 | 194 | 3750 | male | 2008 |
| Adelie | Biscoe | 41.6 | 18.0 | 192 | 3950 | male | 2008 |
| Chinstrap | Dream | 50.9 | 19.1 | 196 | 3550 | male | 2008 |
| Chinstrap | Dream | 49.8 | 17.3 | 198 | 3675 | female | 2009 |
| Gentoo | Biscoe | 47.8 | 15.0 | 215 | 5650 | male | 2007 |
| Adelie | Torgersen | 34.6 | 21.1 | 198 | 4400 | male | 2007 |
| Gentoo | Biscoe | 49.5 | 16.2 | 229 | 5800 | male | 2008 |
| Gentoo | Biscoe | 45.1 | 14.5 | 215 | 5000 | female | 2007 |
As before, we would need to look at the dataset as containing a TARGET column which we want to predict using several other FEATURE columns. Let us choose species.
When we look at the FEATURE columns, We would need to formulate questions based on entire columns at a time. For instance:
- “Is the bill_length_mm greater than 45mm?” considers the entire bill_length_mm FEATURE column
- Is the sex female? considers the entire sex column
If the specific FEATURE column is a Numerical (N) variable, the question would use some “thresholding” as shown in the question above, to convert the Numerical Variable into a Categorical variable.
If a specific FEATURE column is a Categorical (C) variable, the question would be like a filter operation in Excel.
Either way, we end up answering with a smaller and smaller subset of rows in the dataset, to which the questions are answered with a Yes. It is as if we played many 20 Questions games in parallel, since there are so many simultaneous “answers”!
Once we exhaust all the FEATURE columns, then what remains is a subset (i.e. rows) of the original dataset and we read off the TARGET column, which should now contain a set of identical entries, e.g. “Adelie”. Thus we can extend a single-target 20Q game to a multiple-target one using a larger dataset. ( Note how the multiple targets are all the same: “Adelie”, or “Gentoo”, or “Chinstrap”)
This forms the basic intuition for a Machine Learning Algorithm called a Decision Tree.
Decision Tree in Orange
Let us visualize this Decision Tree in Orange. Look at the now famous penguins dataset, available here:
https://raw.githubusercontent.com/mwaskom/seaborn-data/master/penguins.csv
We see that there are three species of penguins, that live on three islands. The measurements for each penguin are flipper_length_mm, bill_length_mm, bill_depth_mm, and body_mass_g.
Task 1: Create a few data visualizations for the variables, and pairs of variables from this dataset.
Task 2: Can you inspect the visualizations and imagine how each of this dataset can be used in a
20 Questions Game, to create a Decision Tree for this dataset as shown below?
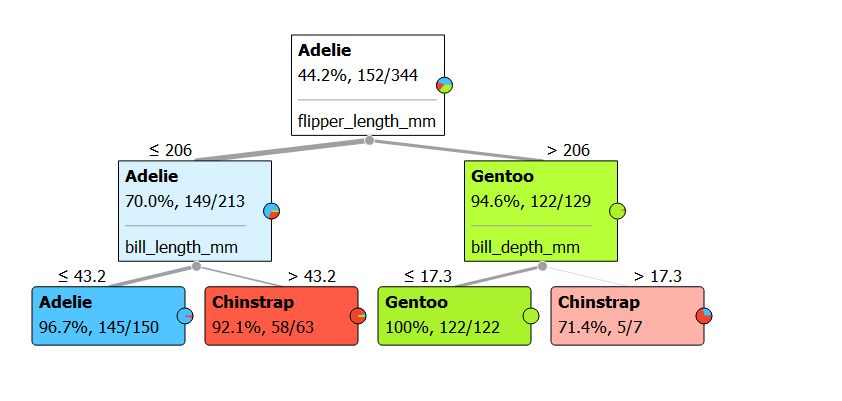
Penguins Decision Tree!
What did we learn?
- The 20Q Game can be viewed as a “Decision Tree” of Questions and Answers,
- Each fork in the game is a Question.
- Depending upon whether the current answer is yes or no, we turn in one direction or the other.
- Each of our questions is based on the information available in one or other of the columns!!
- We arrive at a final “answer” or “target” after a particular sequence of yes/no answers. This is the one of the leaf nodes in the Tree.
- The
islandand thespeciescolumns are categories and are especially suited to being the targets for a 20 Questions Game. - We can therefore use an entire column of data as our 20Questions target, rather than just one entity, person.
This is how we will use this Game as a Model for our first ML algorithm, classification using Decision Trees.
How do we Make Predictions using our Decision Tree
Our aim is to make predictions. Predictions of what? When we are given new unseen data in the same format, we should be able to predict TARGET variable using the same FEATURE columns.
NOTE: This that is usually a class/category (We CAN also predict a numerical value with a Decision Tree; but we will deal with that later.)
In order to make predictions with completely unseen data, we need to first check if the algorithm is working well with known data. The way to do this is to use a large portion of data to design the tree, and then use the tree to predict some aspect of the remaining, but similar, data. Let us split the penguins dataset into two pieces: a training set to design our tree, and a test set to check how it is working.
Download this penguin tree file and open it in Orange.
How good are the Predictions? What is the Classification Error Rate?
How Many Trees do we Need? Enter the Random Forest!
Check all your individual Decision Trees: do they ask the same Questions? Do they fork in the same way? Yes, they all seem to use the same set of parameters to reach the target. So they are capable of being “biased” and make the same mistakes. So we ask: Does it help to use more than one tree, if all the questions/forks in the Trees are similar?
No…we need different Trees to be able to ask different questions, based on different variables or features in the data. That will make the Trees as different as possible and so…unbiased. This is what we also saw when we played 20Q: offbeat questions opened up some avenues for predicting the answer/target.
A forest of such trees is called the Wild Wood a Random Forest !
An Introduction to Random Forests
In the Random Forest method, we do as follows:
- Split the dataset into
trainingandtestsubsets (70::30 proportion is very common). Keep aside thetestingdataset for final testing. - Decide on a number of trees, say 100-500 in the forest.
- Take the training dataset and repeatedly sample some of the rows in it. Rows can be repeated too; this is called bootstrap sampling.
- Give this sampled training set to each tree. Each tree develops a question from this dataset, in a random fashion, using a randomly chosen variable.
E.g. with
penguins, if our target isspecies, then some trees will will useisland, some others will usebody_mass_gand some others may usebill_length_mm. - Each tree will “grow its questions” in a unique way !! Since the questions are possibly based on a different variable at each time, the trees will grow in very different ways.
- Stop when the required accuracy has been achieved (the sets contain observations/rows from only one
speciespredominantly) - With the
test setlet each tree vote on whichspeciesit has decided upon. Take the majority vote.
Phew!!
Let’s get a visual sense of how all this works:
Random Forest Classification for Heart Patients
Do you want to develop an ML model for heart patients? We have a dataset of heart patients at the University of California, Arvind Irvine ML Dataset Repository
Heart Patient Data. Import into Orange !!
What are the variables?
- (age): age in years
- (sex): 1 = male; 0 = female
- (cp): chest-pain type( 4 types, 1/2/3/4)
- (trestbps): resting blood pressure (in mm Hg on admission to the hospital)
- (chol) : serum cholesterol in mg/dl
- (fbs): (fasting blood sugar > 120 mg/dl) (1 = true; 0 = false)
- (restecg): resting electrocardiograph results (0 = normal; 1= ST-T wave abnormality; 3 = LV hypertrophy)
- (thalach): maximum heart rate achieved
- (exang): exercise induced angina (1 = yes; 0 = no) (remember Puneet Rajkumar)
- (oldpeak): ST depression induced by exercise relative to rest
- (slope): the slope of the peak exercise ST segment
- Value 1: upsloping
- Value 2: flat
- Value 3: downsloping
- (ca): number of major vessels (0-3) colored by fluoroscopy
- (thal): 3 = normal; 6 = fixed defect; 7 = reversible defect
- (num) : the target attribute, diagnosis of heart disease (angiographic disease status)
- Value 0: < 50% diameter narrowing
- Value 1: > 50% diameter narrowing
(in any major vessel: attributes 59 through 68 are vessels)
We will create a Random Forest Model for this dataset, and compare with the Desision Tree for the same dataset.
How good is my Random Forest?
- Classification Error
- Gini Impurity
- Cross Entropy
References
The beauty of Random Forests: https://orangedatamining.com/blog/2016/12/22/the-beauty-of-random-forest/
Pythagorean Trees for Random Forests: https://orangedatamining.com/blog/2016/07/29/pythagorean-trees-and-forests/
data.tree sample applications, Christoph Glur, 2020-07-31. https://cran.r-project.org/web/packages/data.tree/vignettes/applications.html
Arvind V.
My research interests are Complexity Science, Creativity and Innovation, Problem Solving with TRIZ, Literature, Indian Classical Music, and Computing with R.