📎 Correlations
How one variable changes with another
 Photo by rawpixel on Unsplash
What graphs will we see today?
Some of the very basic and commonly used plots for data are:
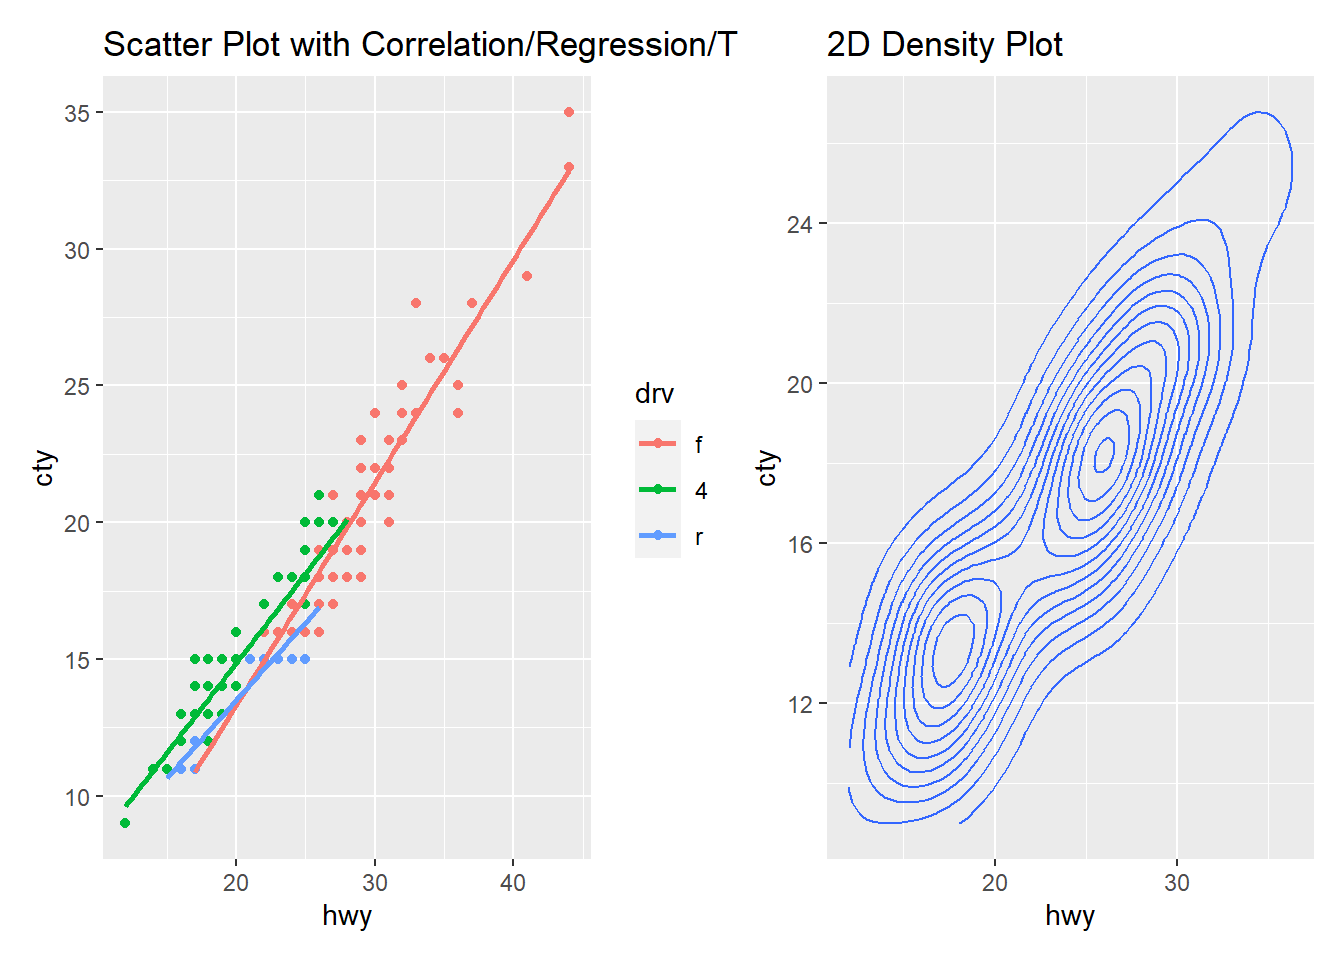
- Scatter Plot
- Contour Plot
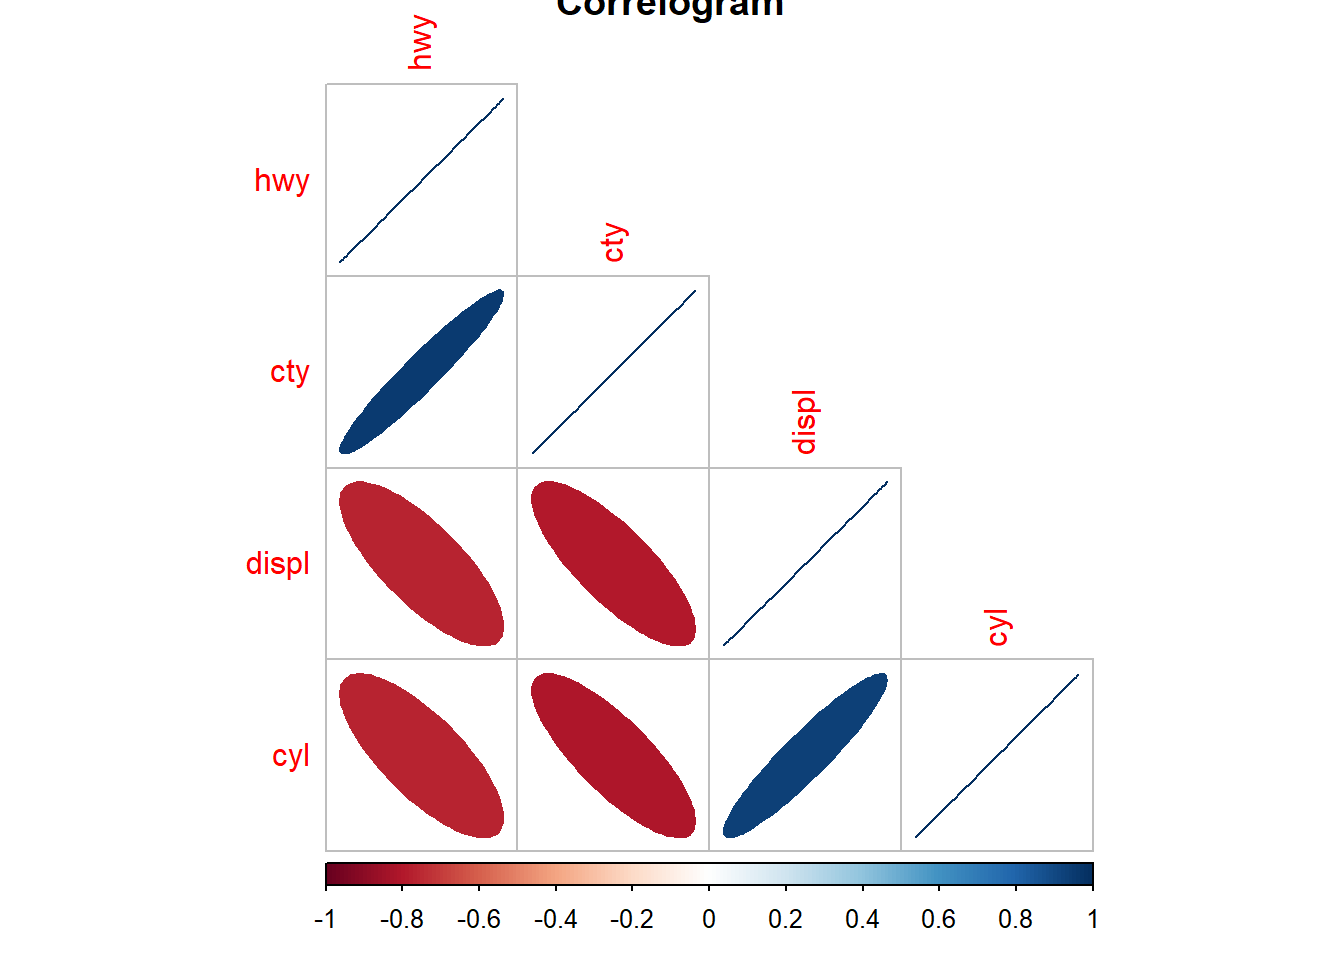
- Correlogram
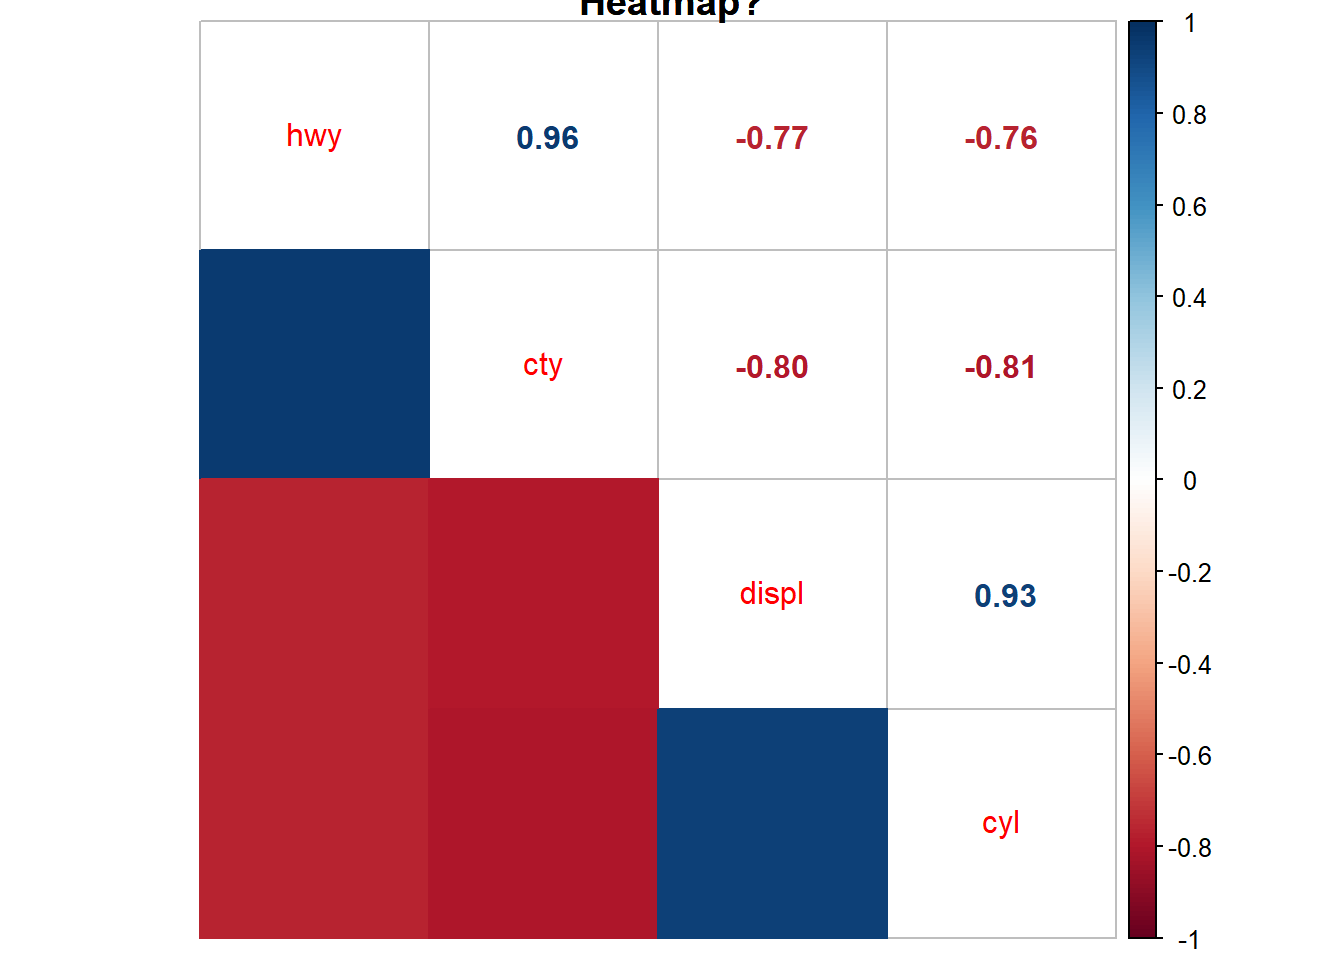
- Heatmap
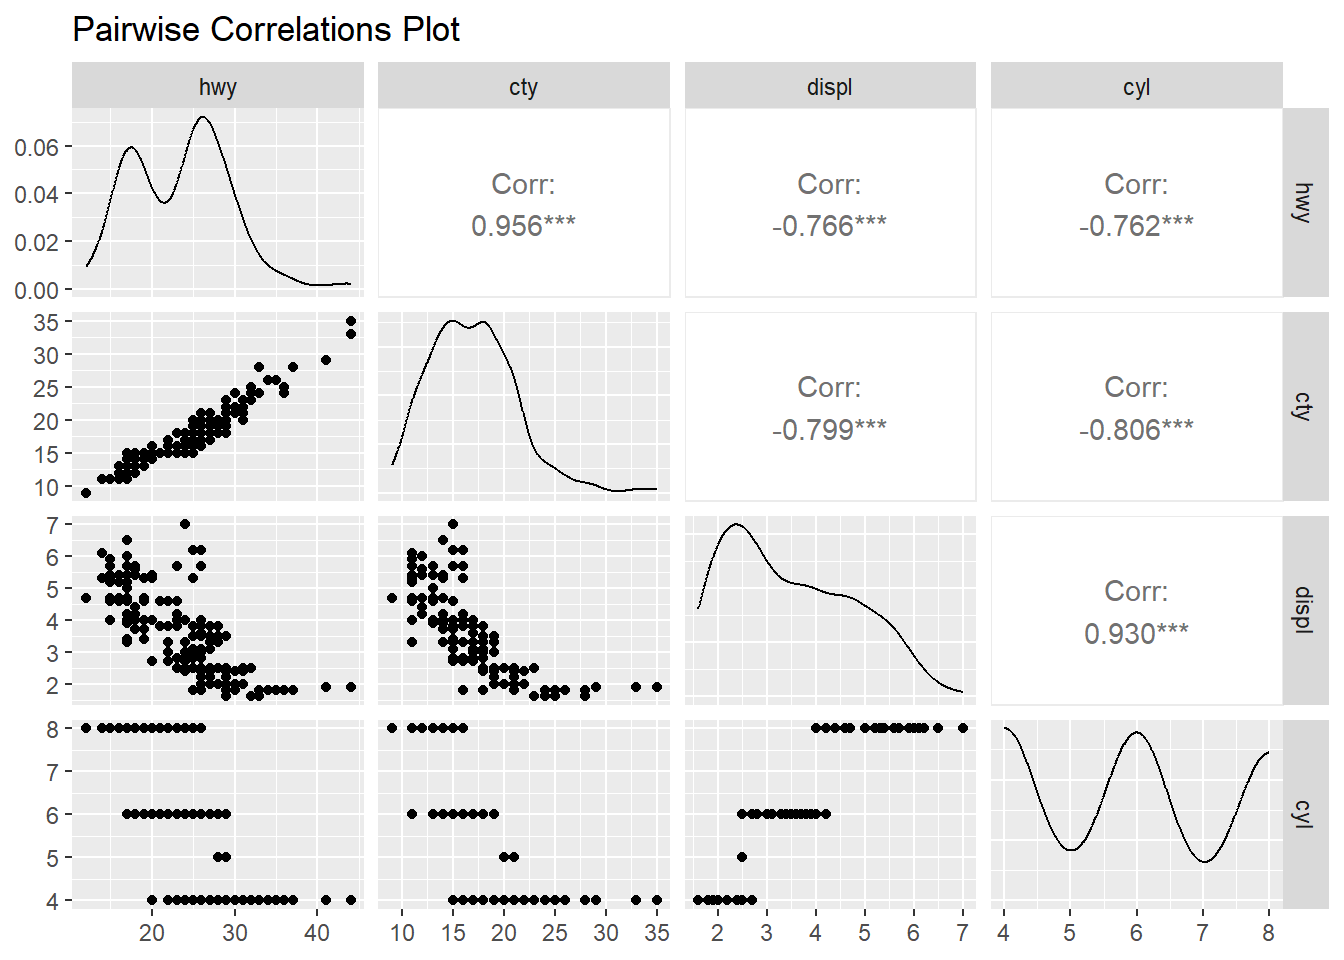
What Correlation Charts can we plot with Numerical / Quantitative Data?
Conclusion
Your Turn
References
- Minimal R using
mosaic. https://cran.r-project.org/web/packages/mosaic/vignettes/MinimalRgg.pdf
Arvind V.
My research interests are Complexity Science, Creativity and Innovation, Problem Solving with TRIZ, Literature, Indian Classical Music, and Computing with R.