 Photo by Omar Flores on Unsplash
Introduction
What is a network?
Network graphs show relationships between entities: what sort they are, how strong they are, and even of they change over time.
We will examine data structures pertaining both to the entities and the relationships between them and look at the data object that can combine these aspects together. Then we will see how these are plotted, what the structure of the plot looks like. There are also metrics that we can calculate for the network, based on its structure. We will of course examine geometric metaphors that can represent various classes of entities and their relationships.
Network graphs can be rendered both as static and interactive and we will examine R packages that render both kinds of plots.
There is a another kind of structure: one that combines spatial and network data in one. We will defer that for a future module !
Packages that we will need
knitr::opts_chunk$set(echo = TRUE)
library(tidyverse)

library(tidygraph) # Creating Graph objects and analyzing them
library(ggraph) # Plotting graphs with various layout options
library(graphlayouts) # More layout options
library(igraphdata) # Sample graph datasets

library(sand) # Statistical Analysis of Graph Data
What kind Network graphs will we make?
Here is a network map of the characters in Victor Hugo’s
Les Miserables:
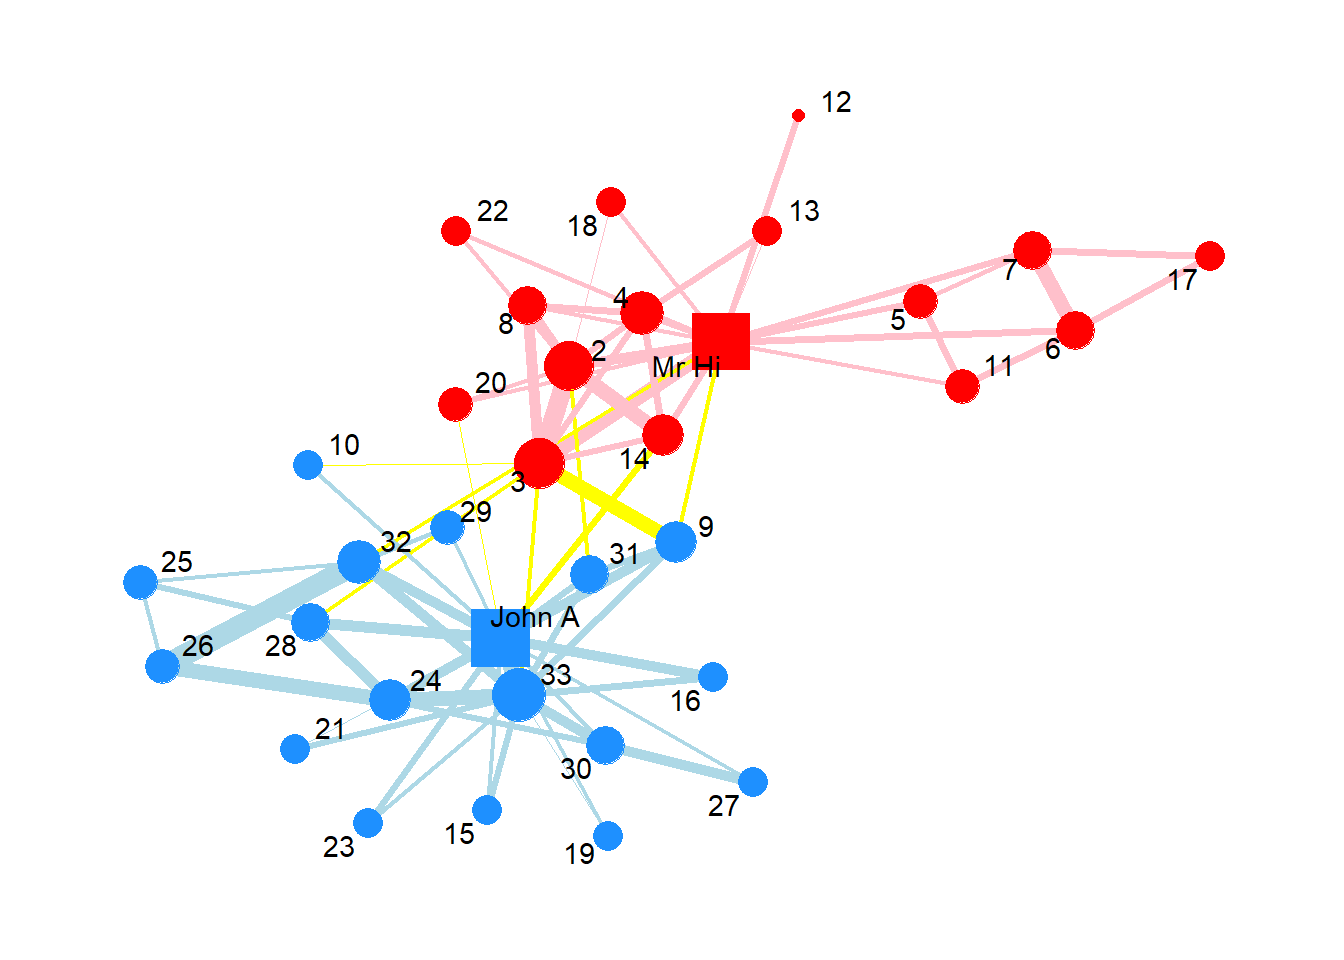
And this:
Conclusion
We see that Networks reveal Structure of relationships between entities, their types and strengths, and also reveal behavioural aspects as to which entities or relationships are important which are peripheral to the overall network.
References
Hadley Wickham, Danielle Navarro, and Thomas Lin Pedersen, ggplot2: Elegant Graphics for Data Analysis.https://ggplot2-book.org/networks.html
Omar Lizardo and Isaac Jilbert, Social Networks: An Introduction. https://bookdown.org/omarlizardo/_main/
Mark Hoffman, Methods for Network Analysis. https://bookdown.org/markhoff/social_network_analysis/
Eric D. Kolaczyk and Gábor Csárdi. Statistical Analysis of Network Data with R, 2nd Edition.https://github.com/kolaczyk/sand
Arvind V.
My research interests are Complexity Science, Creativity and Innovation, Problem Solving with TRIZ, Literature, Indian Classical Music, and Computing with R.