 Photo by rawpixel on Unsplash
Where does Data come from?
Let us look at the slides.
Why Describe and Graph Data?
- Summaries are compressed data
- We can digest information more easily when it is pictorial
- Our Working Memories are both short-term and limited in capacity. So a picture abstracts the details and presents us with an overall summary, an insight, or a story that is both easy to recall and easy on retention.
- Business Data Viz includes shapes that carry strong cultural and business memories and impressions for us. These cultural memories help us to use data viz in a universal way to appeal to a wide variety of audiences. (Do humans have a gene for geometry?)
- It helps sift facts and mere statements: for example:

Figure 1: Source https://www.deccanherald.com/national/india-is-known-as-the-rape-capital-of-the-world-rahul-783495.html
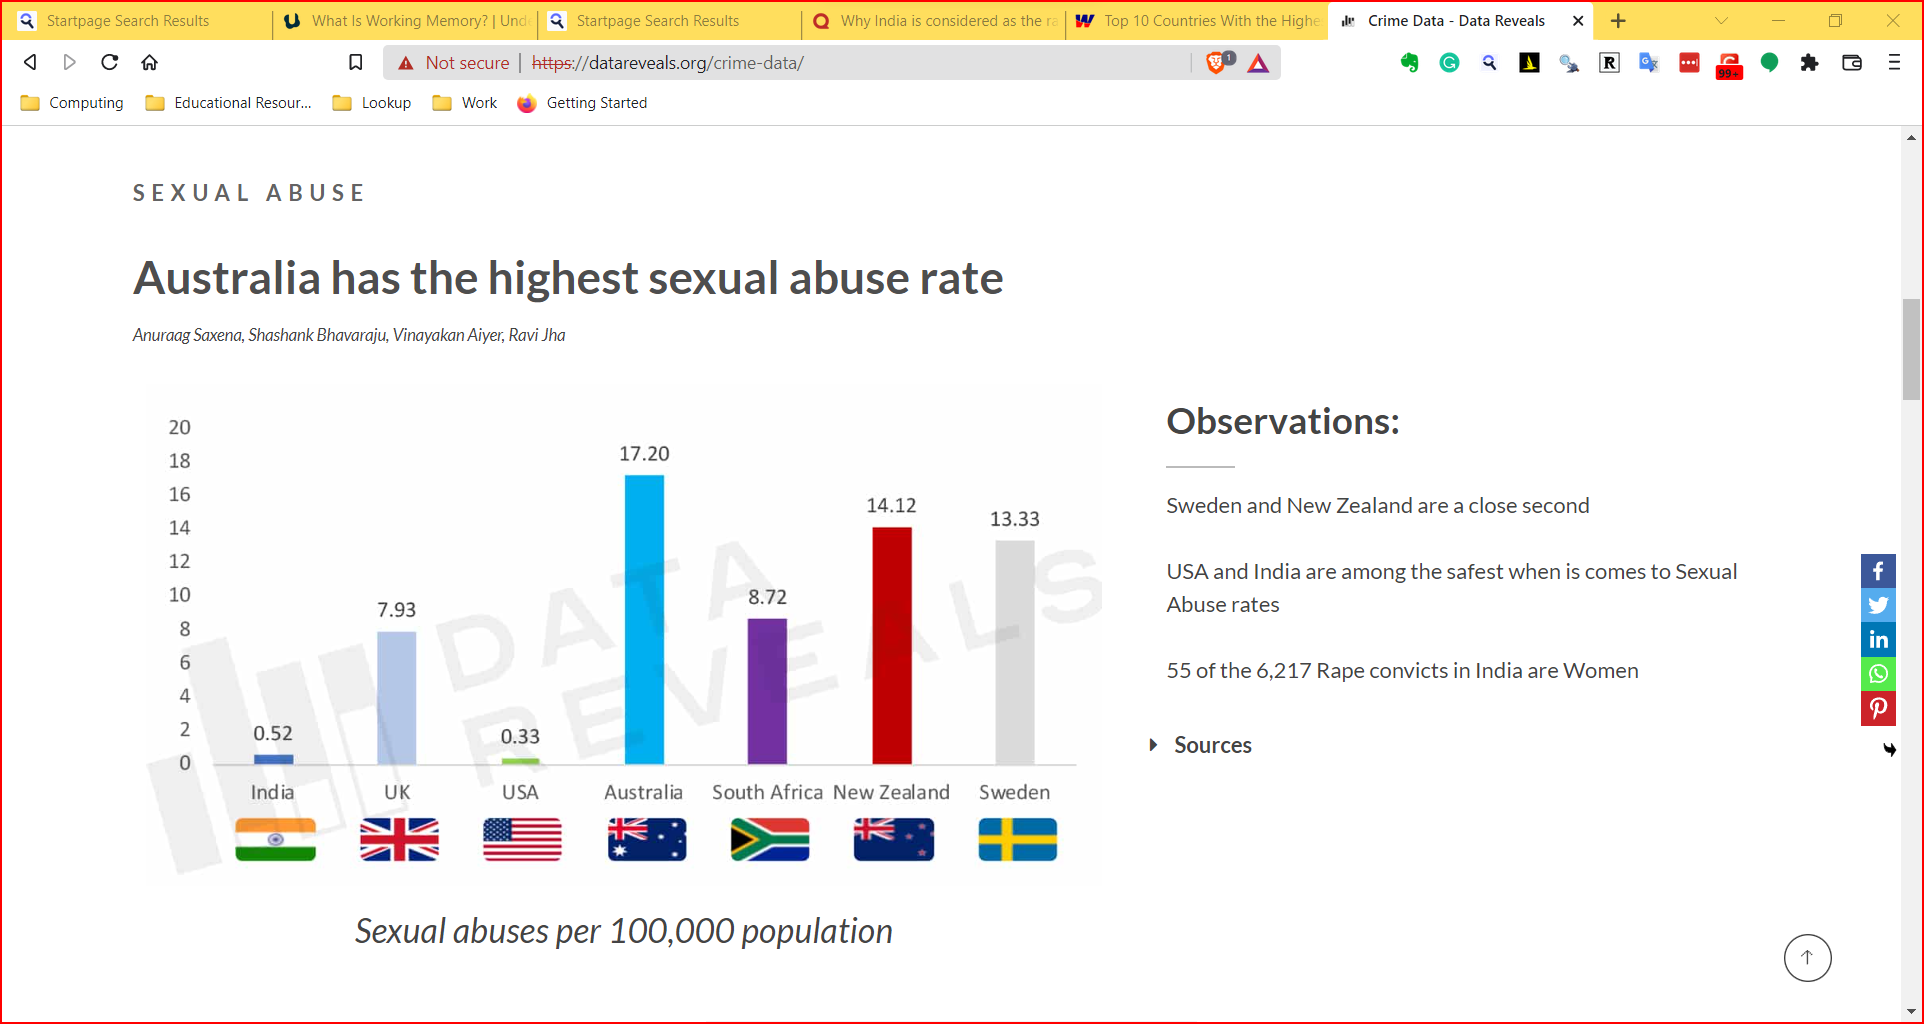
Figure 2: Source https://datareveals.org/crime-data/
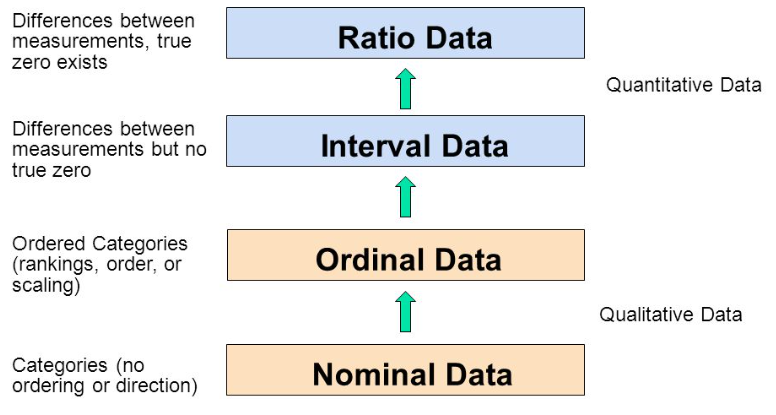
How do we Spot Data Variable Types?
By asking questions!
| Pronoun | Answer | Variable / Scale | Example | What Operations? |
|---|---|---|---|---|
| What, Who, Where, Whom, Which | Name, Place, Animal, Thing | Qualitative / Nominal | Name |
|
| How, What Kind, What Sort | A Manner / Method, Type or Attribute from a list, with list items in some ” order**” ( e.g. good, better, improved, best..) | Qualitative / Ordinal |
|
|
| How Many / Much / Heavy? Few? Seldom? Often? When? | Quantities with Scale. Differences are meaningful, but not products or ratios |
Quantitative / Interval |
|
|
| How Many / Much / Heavy? Few? Seldom? Often? When? | Quantities, with Scale and a Zero Value. Differences and Ratios /Products are meaningful. (e.g Weight ) |
Quantitative / Ratio** |
|
|
As you go from Qualitative to Quantitative data types in the table, I hope you can detect a movement from fuzzy groups/categories to more and more crystallized numbers. Each variable/scale can be subjected to the operations of the previous group. In the words of S.S. Stevens ,
the basic operations needed to create each type of scale is cumulative: to an operation listed opposite a particular scale must be added all those operations preceding it.
References and Reading
- Datasets Have Worldviews,https://pair.withgoogle.com/explorables/dataset-worldviews/