🧭 Descriptive Analytics

Introduction
We will explore visualizing of different kinds of data in this set of modules.
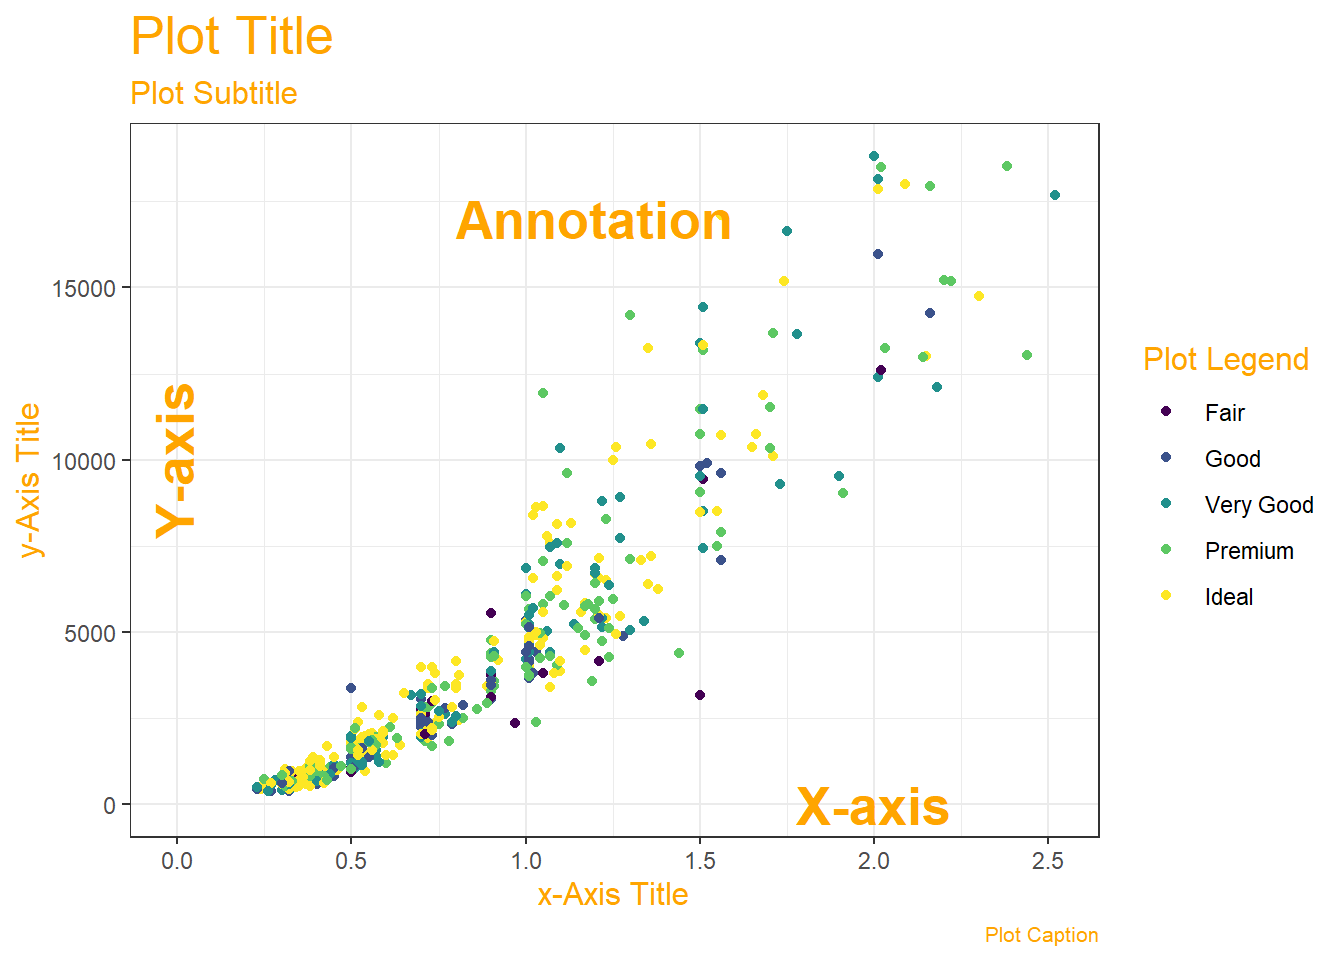
What Are the Parts of a Data Viz?
How to pick a Data Viz?
Most Data Visualizations use one or more of the following geometric attributes or aesthetics. These geometric aesthetics are used to represent qualitative or quantitative variables from your data.
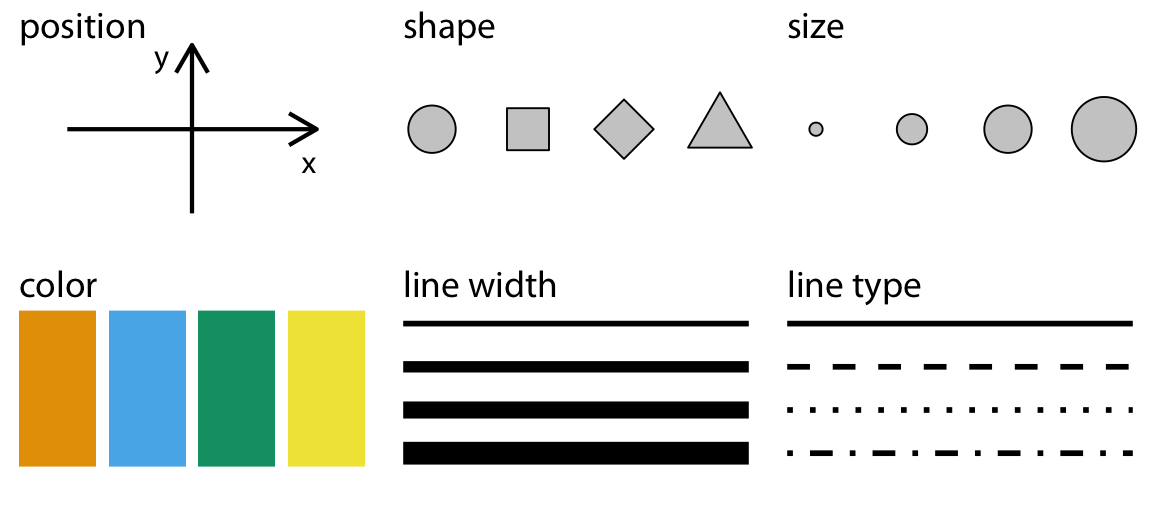
What does that mean? We can think of simple visualizations as combinations of these aesthetics. Some examples:
| Aesthetic #1 | Aesthetic #2 | Shape | Chart Picture |
|---|---|---|---|
| Position X = Quant Variable | Position Y = Quant Variable | Points/Circles with Fixed Size and/or Line |  |
| Position X = Qual Variable | Position Y = Count of Qual Variable | Columns |  |
| Position X = Qual Variable | Position Y = Qual Variable | Rectangles, with area proportional to joint (X,Y) count |  |
| Position X = Qualitative Variable | Position Y = Rank Ordered Quant Variable | Box + Whisker, Box length proportional to Inter-Quartile Range, whisker-length proportional to upper and lower quartile resp. |  |
| Position X = Quant Variable | Position Y = Quant Variable + Quant Variable | Lines + Area between Lines |  |
In the following set of Modules we will see how different geometries lend themselves to making charts that are meaningful in a Business context.
References
-
https://awagaman.people.amherst.edu/stat230/Stat230CodeCompilationExampleCodeUsingNHANES.pdf
-
Kyle W. Brown, R-Gallery-Book. <https://www.kyle-w-brown.com/R-Gallery/
-
Descriptive Analytics @ University of Cincinnatti Business Analytics http://uc-r.github.io/descriptive
-
Data Viz Glossary. https://observablehq.com/embed/@a10k/data-visualization-glossary?cell=*